
EN ISO 6781-1 · ISO 9869-1
Thermography and insulation testing.
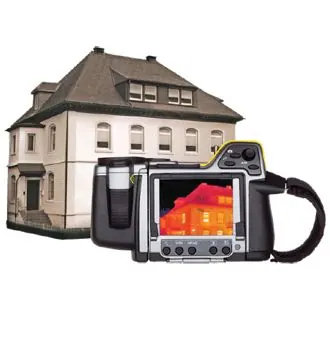
A thermal camera shows where a building loses heat, and in-situ heat-flow measurement tells how well a wall or roof insulates. Both methods are in our accredited scope.
- ATS 01-008accredited lab
- ISO/IEC 17025:2017
- since 2001accredited
- AThermal camera
- BThermal bridge at the ring beam
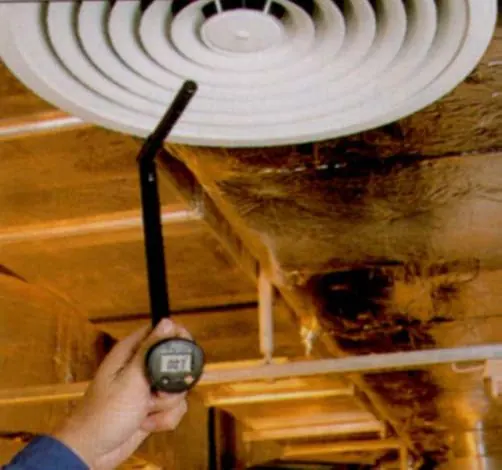
- CHeat-flux sensor (U-value)
- DReport with thermograms
- 1Thermal camera and test conditions
- 2The thermogram reveals temperature patterns
- 3Thermal bridges and heat-flow (U-value) measurement
- 4Report with thermograms and recommendations
What we test
Thermography & insulation testing
Building thermography
Thermal bridges, insulation defects, window installation and air leaks (EN ISO 6781-1:2023).
Plant and installation thermography
District heating, thermal power and electrical installations, −10 to 1500 °C.
Heat transmission and thermal resistance
In-situ heat-flow-meter method (ISO 9869-1:2016, SRPS U.J5.062).
Moisture and condensation
Thermograms reveal cold areas where condensation and mould appear.
Air permeability
Combined with a blower door test, air leaks are easy to find.
Accreditation and standards
ATS 01-008 scope of accreditation
The tests on this page are covered by the scope of accreditation of our Testing and Measurement Laboratory. Reports carry the accreditation mark; methods and ranges are listed below.
- Accreditation No.
- ATS 01-008
- Standard
- ISO/IEC 17025:2017
- Initial accreditation
- 3 Sep 2001
- Valid until
- 15 Mar 2027
| Subject | Test | Range | Reference document |
|---|---|---|---|
| Building structures | Heat transmission; thermal resistance and thermal transmittance | −25 °C to 20 °C; 0–150 W/m² | SRPS U.J5.062:1984 (withdrawn); SRPS ISO 9869-1:2016 |
| District heating, thermal power installations, electrical power plants, building thermal insulation | Thermographic testing | −10 °C to 1500 °C | SRPS EN ISO 6781-1:2023; FLIR manufacturer manual |
Process
How it works
- 01
Test conditions
We survey when the indoor–outdoor temperature difference is sufficient, usually in the heating season.
- 02
Outside and inside survey
Façade, roof, windows and details.
- 03
U-value measurement
Heat-flux and temperature sensors log data over several days.
- 04
Analysis
Thermogram interpretation and thermal resistance calculation.
- 05
Report
Report with thermograms, results and recommendations.
What you get
Report and results
- Thermography report with thermograms
- Measured U-value and thermal resistance
- Marked thermal bridges and defects
- Repair recommendations
Who needs it
Who we work for
- Owners with high heating bills
- Developers before handover
- Façade and window contractors
- District heating and power plants
- Property buyers
FAQ
Frequently asked questions
What does thermography show?
The surface temperature distribution: thermal bridges, missing insulation, poorly fitted windows and damp areas.
When is the best time?
When the indoor–outdoor temperature difference is large, usually in the heating season, early morning or evening, without direct sun.
How is a wall U-value measured?
A heat-flux sensor goes on the wall with temperature sensors on both sides; logging takes several days and the U-value is calculated to ISO 9869-1.
Is it accredited?
Yes. Thermography to EN ISO 6781-1:2023 and heat transmission to ISO 9869-1:2016 are in our ATS 01-008 scope.
Contact
Tell us what needs testing.
Send the building type, location and the test you need, and we will reply with a quote and a date.
